Analysis of the Forces That Drive Competition in the Eastern Redcedar Makret
Force 1: Threat of new entrants (Barriers to entry)
The phone survey respondents identified the following barriers to entering the redcedar industry:
 |
 |
 |
 |
 |
 |
Percentage of respondents that identified barriers to entry the redcedar industry
Barriers to entry are perceived differently by companies already in the market and those trying to enter the market. The more difficult the barriers are to overcome, the better they protect the companies already in the market from potential new entrants.
|
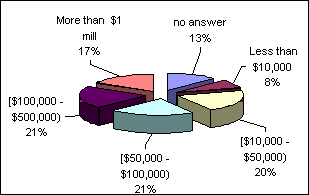
| Figure 17: Initial capital costs required to start a business (phone survey) |
Capital requirements were perceived as the most important barrier to entering the redcedar industry. Initial capital costs required to start a business ranged from less than $10,000 to more than $1 million (Figure 17). Most of the companies in the redcedar business obtained initial capital by self-financing or personal loans.
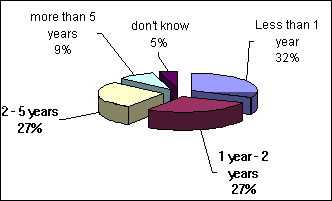
While it is possible to obtain bank loans, the fact that most of the redcedar businesses operate without contracts (see Figure 19) makes it harder to establish credit with financial institutions. If the company has the capital required to start its activity, and can overcome the other barriers to entry, the chances that the company will become profitable in a relatively short time are quite high. Thirty-two percent of the companies surveyed stated that they became profitable in less than one year and 86% in less than 5 years (Figure 18).
|
| Figure 18: Time to become profitable |
While it is possible to obtain bank loans, the fact that most of the redcedar businesses operate without contracts (see Figure 19) makes it harder to establish credit with financial institutions. If the company has the capital required to start its activity, and can overcome the other barriers to entry, the chances that the company will become profitable in a relatively short time are quite high. Thirty-two percent of the companies surveyed stated that they became profitable in less than one year and 86% in less than 5 years (Figure 18).
While not explicitly derived from survey data, availability of cedar logging infrastructure is most likely a larger barrier than availability of trees and logs.
From our limited responses it appears that there is a relatively high potential to start a business without a huge capital investment. One of the companies surveyed started with a $20,000 investment and today has sales exceeding $10 million per year.
Clearly the survey population represents a somewhat biased sample as these are the firms that have succeeded and remained in business. Furthermore, it is likely that only those firms doing well in the redcedar marketplace at this time consented to participate in the phone survey.
Lack of knowledge and experience was the second barrier to entry mentioned in order of importance. To successfully enter the redcedar industry one must have detailed knowledge about the industry. Redcedar is unique regarding its management, cutting, grading and processing. Because of its uniqueness, a specialized knowledge base is required from market participants.
Knowledge about how to establish and maintain relationships along the value chain helps assure both entry and survival in the redcedar business. Redcedar markets are generally small, local markets that are influenced heavily by reputation, frequency of transactions and strong personal relationships. In order to enter the market, a new participant would have to understand the social aspects of the market and develop strong transaction relationships. While a barrier for potential entrants, this factor favors the companies already in the market that have cultivated and maintained strong relationships with their suppliers and customers.
Access to inputs and access to markets were equally valued by the respondents. In areas where cedar manufacturers are located, everything that is produced is marketable including primary manufacturing by-products such as shavings and sawdust. For start-up companies outside those areas, the sale of by-products would probably be difficult without significant marketing efforts. For example, without a developed poultry raising business the sale of cedar sawdust (especially from band sawing) would be difficult. Identifying and securing markets for the main products and also for the by-products is very important for successful entry and survival in the redcedar business.
Labor intensity and economies of scale were identified by some respondents as barriers to entry but less important than other factors already discussed. Labor is considered a barrier in terms of the intensity required in manufacturing redcedar products.
Economy of scale can be a barrier because some redcedar products are sold at very low margin. Companies that produce these products must generate large volumes in order to cover fixed costs and generate profit.
The size of firms contributes to the perception of "high volume". High volume for Missouri cedar producers is rather low compared to other segments of wood industry.
Forces 2 and 3: The Bargaining Power of Suppliers and Buyers
The value chain in the redcedar market starts with the landowner that supplies the raw logs and ends with the retailer who ultimately adds value to the product before reaching the final consumer (see Fig.1, page 7). Most of the participants are involved in both supplying and buying redcedar products. Some of the companies are vertically integrated, being involved in two or more steps in product conversion.
Suppliers
According to the mail survey, loggers are the primary supplier of raw material (36%), followed by primary manufacturers and landowners (18%), wholesalers (12%) and timber brokers (6%).
Based on the phone interviews, landowners are the number one supplier (52%), followed by loggers (32%), primary manufacturers (20%), brokers (8%) and wholesalers (4%).
The results are influenced by the fact that the majority of companies interviewed were primary manufacturers who use private landowners as suppliers of raw material.
|
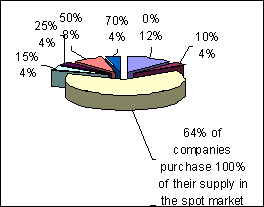
| Figure 19: Percentage of supply that is purchased in the spot market (phone survey) |
Characteristics of the value chain based on the phone survey results, from the suppliers' perspective
Suppliers in the value chain are relatively small companies in terms of annual sales (only 32% of companies surveyed were supplied by companies with over $1 million annual sales; a further 20% had suppliers with annual sales between $250,000 and $1 million.
Transactions take place mostly in the spot market. Out of the companies surveyed, 64% purchase all (100%) of their supply in the spot market and only 12% purchase all (100%) of their supply through contractual arrangements, most of them verbal contracts (Fig.19). This may indicate that there is enough supply available that there is no need to secure a transaction through a contract; or it may indicate that the relationship between suppliers and buyers is based on trust and neither the supplier nor the buyer exerts bargaining power.
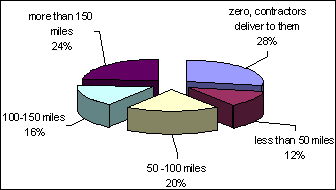
In terms of the distance a company is willing to go to purchase redcedar materials, we identified two extremes: (Figure 20)
- 28% of companies surveyed do not travel to get their supply because they have private landowners, local loggers or brokers deliver to them,
- 24% of companies surveyed are willing to go more than 150 miles to get the supply.
|
| Figure 20: Farthest distance willing to go to purchase redcedar materials (phone survey) |
The fact that some of the companies don't need to travel to get the supply indicates that they are in a more powerful position than their suppliers.
The fact that some manufacturers are willing to travel over 150 miles in order to acquire inputs indicates that there may be supply shortages in certain areas of the country or there are other factors affecting the supply of redcedar.
The industry has high potential for vertical integration (36% of the companies surveyed are involved in two or more steps in product conversion, for example taking the raw log and manufacturing consumer goods such as tongue and groove paneling, mulch or novelties). Vertical integration allows a firm to have more control over its supply needs.
Trends in Redcedar Supply
With the results obtained from the mail survey, we identified some trends in redcedar supply. The phone survey helped us describe the trends in more detail for different levels of quality.
|
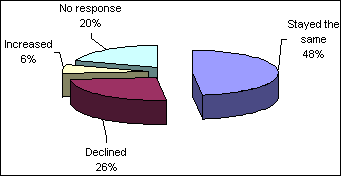
| Figure 21: Changes in the supply of eastern redcedar products over the last five years (mail survey) |
General Trends for Eastern Redcedar Supply
Roughly half of the respondents to the mail survey indicated that over the past five years redcedar supply had remained steady. An additional quarter (26%) of respondents felt that redcedar supply had declined and only 6% indicated that supply had increased during this same period (Figure 21).
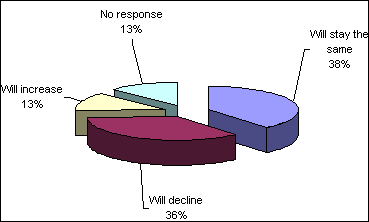
More importantly, in the next five years, almost 40% of the survey respondents felt that supply will remain steady, 36% felt that supply will decline and 13% see supply increasing. Survey participants expected the current changes to continue into the future (Figure 22).
|
| Figure 22: Changes in the supply of eastern redcedar products over the next five years |
Specific Trends for Eastern Redcedar Supply
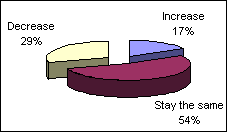
The phone survey further investigated supply trends and the factors that influence them. Supply trends in the next 10 years were analyzed for different levels of quality. More than half of the respondents to the phone survey (54%) believed that the supply of good quality redcedar materials will stay the same, 29% indicated that the supply of good quality redcedar materials will decrease and 17% felt that the supply will increase (Figure 23).
In terms of average quality, 70% of respondents said that the supply will stay the same, 13% said that the supply will decrease and 13% felt that the supply will increase (Figure 24).
|
| Figure 23: Supply of good quality redcedar materials over the next 10 years (phone survey) |
The opinion about the supply of poor quality redcedar materials is as follows: 48% felt that it would remain steady, 39% expected an increase and 9% expected a decrease.
The overall conclusion from the surveys is that the supply of all quality levels of redcedar materials is likely to stay the same. However, it is possible that a shortage of good quality redcedar material and an increase in poor quality material will occur in the next 10 years.

|
| Figure 24: Supply of average quality redcedar materials over the next 10 years (phone survey) |
Additional information about the redcedar resource, obtained from U.S. Forest Service (USFS) Forest, Inventory and Analysis (FIA) data3, raises questions about the supply concerns expressed in the surveys. Based on FIA data there should be an abundance of quality redcedar available, at least for some regions. The four states with the highest census of redcedar are Arkansas, Tennessee, Kentucky and Missouri (See Appendix figures IV, V, and VI).
Note: This data is strictly derived from forest land inventory and does not include non-forest land or other land classes, thus does not include what appears to be a huge component of the emerging resource.
These four states account for 53% of the nation's redcedar (Eastern redcedar).
Phone surveys reveal that the most desirable cedar falls within the 6-8" dbh range, typically thought to be between 35 and 45 years old. If we look at the data on the existing redcedar resource in the top 4 states, (Figure 25) we see that 15% of the trees fall in the most desired, 6-8" dbh class. These are the trees at the optimum age with the least amount of age related defect.
Looking into the future, 22% of the resource is in the 4" dbh class (3.1-5.0"). Assuming an average growth rate of .2" dbh per year, all of this cedar would be desirable for harvest (at 6" dbh) within the next 5-15 years. Even if we assumed a 20% mortality in this age class, we would have a harvestable resource at least as large as what is presently available.
Looking further into the crystal ball, those trees in the 2" (1.0-3.0") dbh class constitute a massive 61% of the total number of trees inventoried. Again, let's assume a 50% mortality and an average growth rate of 0.2" per year. On average these trees would be of harvestable size within 25-35 years. Following this logic a bit further, this would present the industry with twice as much harvestable cedar inventory on the stump as is currently available.
Boiling all of this down, the current raw inventory data shows that the useable redcedar resource will be slowly increasing in quantity for the next 3 decades. Information on the silviculture (reproduction, biology, growth) of redcedar can be found online at: http://www.na.fs.fed.us/spfo/pubs/silvics_manual/Volume_1/juniperus/virginiana.htm
3 - Personal communication with Neal Sullivan - Ecologist, USDA Forest Service, North Central Research Station, 202 ABNR Building, Columbia, MO 65211
| State | Total number of trees (Mill) | 2"diam class (1.1-3.0) (Mill) | 4" dbh (3.1-5.0) (Mill) | 6" dbh (5.1-7.0) (Mill) | 8" dbh (7.1-9.0) (Mill) | % available at present (6/8" dbh) | % available 10-20 yrs (4" dbh) | % available 20+ yrs (2" dbh) |
| Arkansas | 451 | 296 | 89 | 34 | 20 | 12% | 20% | 66% |
| Kentucky | 400 | 239 | 94 | 38 | 18 | 14% | 24% | 60% |
| Tennessee | 437 | 244 | 99 | 49 | 26 | 17% | 23% | 56% |
| Missouri | 384 | 226 | 89 | 40 | 18 | 15% | 23% | 59% |
| 4 state total | 1,672 | 1,005 | 371 | 161 | 81 | 15% | 22% | 60% |
| % of nation | 53% | 52% | 53% | 55% | 60% | |||
| Nationally | 3,142 | 1,922 | 702 | 291 | 135 | 14% | 22% | 61% |
Figure 25: Redcedar on timberland, by state (USFS FIA data)
|
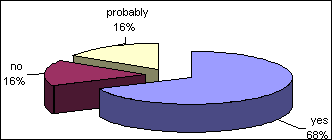
| Figure 26: Availability of redcedar in the area to meet the companies' needs in the next 10 years (phone survey) |
Overall, the perception of the phone survey respondents is optimistic. Along with the aforementioned trends, they still expect to have enough redcedar available in their primary area to meet their supply needs in the next 10 years (Figure 26).
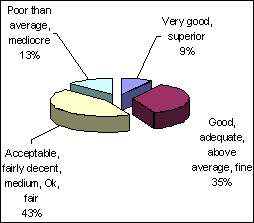
The highest number of respondents (43%) felt that the quality of redcedar available through the supply channel is acceptable, 35% indicated that the quality is good, a smaller percentage consider the quality mediocre (13%) and 9% consider the quality of redcedar available through the supply channels very good. (Figure 27).
|
| Figure 27: Quality of redcedar (phone survey) |
Current industry trends that influenced supply
Some current industry trends that contributed to the increase in redcedar supply are: land conversion to hunting uses retaining cedar as escape cover and winter shelter for deer and turkey, restrictions on wood burning and the growing popularity of small portable saw mills. New housing developments replacing forested land, clearing land for pasture, and development of industry in rural areas are some examples of current industry trends that decreased supply of redcedar materials
Buyers
|
| Figure 28: Primary buyers (mail survey) |
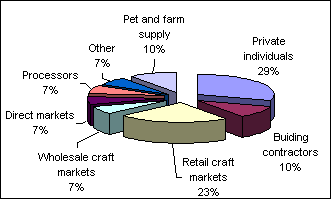
Figure 28 identifies the predominant buyers from the mail survey. The predominant group of buyers identified is private individuals (29%) which includes consumers, do-it-yourselfers, and domestic wood-workers. The retail craft market was the second most predominant buyer (23%).
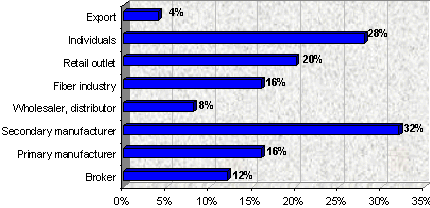
The phone survey had secondary manufacturers listed as primary buyers (32%), individuals being considered as the second largest category of buyers (28%) and retailers were listed as the third most common buyer (20%). (Fig. 29)
|
| Figure 29: Primary buyers (phone survey) |
Characteristics of the value chain based on the phone survey results, from the buyers' perspective
The largest segment of buyers can be classified as resellers:
- 80% of the respondents sell 50% (or more) of their products to resellers,
- 36% sell 50% (or more) direct to final consumers (end-users).
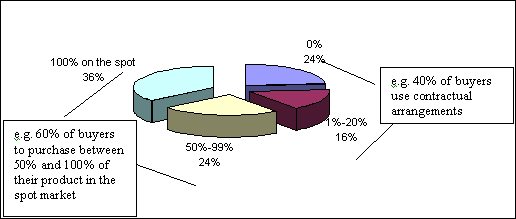
On the buyers' side, similar to the suppliers, the market can be characterized as a spot market:
- 60% of buyers purchase more than half of their supply on the spot,
- 40% of buyers use contractual arrangements. The relationship between buyer and seller becomes more formal (more contractual arrangements) as the value chain approaches the retail segment (Fig. 30).
|
| Figure 30: Percent of buyers that purchase on the spot (phone survey) |
Marketing area
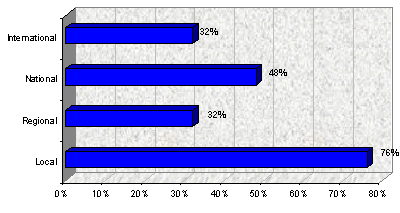
Seventy six percent of the respondents sell their products in local markets. Forty-eight percent of respondents sell their products nation wide and 32% also have international customers (Figure 31). The products sold internationally include lumber, boxes, logs, manufactured parts, and pet shavings.
|
| Figure 31: Marketing area (phone survey) |
In terms of primary marketing area, 52% of respondents have a local market, 36% have a national market and 12% have a regional market as their primary marketing area (Figure II, Appendix).
Trends in Redcedar Demand
Results from the mail survey identified general trends in redcedar demand. The phone survey helped describe the trends in more detail, for various levels of quality.
|
| Figure 32: Changes in the demand for eastern redcedar products over the last five years (mail survey) |
General Demand Trends for Eastern Redcedar
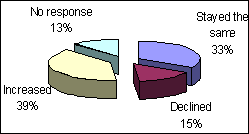
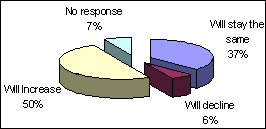
On the demand side (Figures 32 and 33), about one third of the respondents feel that demand has been steady over the past five years and a slightly higher percentage, 37%, feel that demand will remain steady in the coming five years.
|
| Figure 33: Changes in the demand for eastern redcedar products over the next five years (mail survey) |
A larger percentage of respondents (~50%) feel that demand will increase in the coming years in comparison to the previous five years (39%).
Specific Demand Trends for Eastern Redcedar

|
| Figure 34: Demand for good quality redcedar materials/products over the next 10 years (phone survey) |
Phone survey results enabled further investigation of demand trends and the factors that influence them. We analyzed the demand trends in the next 10 years for different levels of quality. Almost 3/4 of the respondents (72%) believed that the demand for good quality redcedar materials would increase, 20% felt that the demand for good quality redcedar materials would remain the same and 4% felt that the demand would decrease (Fig. 34).
|
| Figure 35: Demand for average quality redcedar materials/products over the next 10 years (phone survey) |
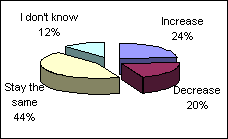
In terms of average quality redcedar, 44% of respondents felt that the demand would stay the same, 24% felt that demand would increase and 20% felt that demand would decrease (Fig. 35).
Demand for poor quality redcedar materials is as follows: 40% feel that demand will decrease, 24% feel that it will remain steady, and 16% feel that it will increase (Fig. 36).
|
| Figure 36: Demand for poor quality redcedar materials/products over the next 10 years (phone survey) |
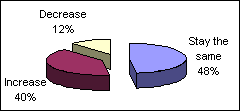
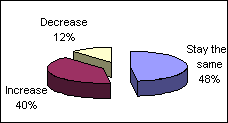
Bottom line, the perception of the phone survey respondents is that the demand for redcedar products in their primary marketing area will stay the same (48%) or increase (40%). (Fig.37).
The logical conclusion is that demand for redcedar materials will remain the same or increase. More specifically, demand for good quality cedar will increase; demand for average quality will stay the same; and the demand for poor quality will decrease. This trend is expected as the redcedar industry continues to upgrade its standards to produce higher quality products.
|
| Figure 37: Demand for redcedar materials/products in the primary marketing area (phone survey) |
In the future, the focus should be on good quality redcedar material. Given the substantial projected increase in the resource base, good quality redcedar should be readily available in major redcedar regions of the United States (AR, KY, MO, TN).
Current industry trends that influence demand
Current industry trends that have increased the demand for redcedar products include an increase in exports, changing fads (such as western style furniture or using cedar mulch for landscaping) and growth in the use of cedar bedding in the poultry industry. Other trends that directly influence demand include the recent influx of poor quality redcedar products and the ban on copper chromated arsenate (CCA) treated lumber.
The sluggish economy, tourism markets (which support the novelty markets), and the importation of substitute products also have an indirect influence on the demand for eastern redcedar products.
In conclusion, based on the results of both the mail and phone surveys, very little bargaining power is exerted along the value chain. At the level represented by landowners and loggers there is little to no power. Those products are not differentiated and are perceived as commodities with no cost for buyers to switch from one supplier to another. As primary and secondary manufacturers add value to the product, bargaining power could possibly increase along the chain.
From the buyers' perspective, very little, if any, bargaining power is exerted. There doesn't appear to be one single buyer that purchases large volumes of redcedar material. However, it should be noted that the large volume "do-it-yourself" home improvement stores, such as Lowe's and Home Depot, were not included in the surveys. It is possible that they would have some bargaining power over suppliers, due in part to their large volume and customer exposure.
Force 4: Threat of substitute products or services
Following the mail survey, the conclusion was that western redcedar (Thuja plicata) may pose a threat as a substitute for eastern redcedar and that in general, the trend toward products that are "natural" (not chemically treated) provides eastern redcedar an advantage over other types of substitutes.
The results of the phone survey provided more detailed information about the potential substitutes for eastern redcedar based on specific uses of the wood.
Construction
The beauty, fragrance, durability, ease of maintenance and resistance to insect infestation
and decay makes eastern redcedar the material of choice for many construction companies and
individuals. Compared to eastern redcedar lumber, western redcedar lumber can be of better
quality (longer, wider material) and more readily available. But western redcedar has a
shorter life span, is harder to mill, splinters easily, lacks the smell and resistance to
insect infestation, and is more expensive.
By injecting wood with chemicals, treated wood receives some of the properties possessed naturally by eastern redcedar: rot resistance and splinter-free. Treated wood can be cheaper and more available but contains harmful chemicals such as arsenic. Treated lumber is also subject to EPA regulations.
Redwood could be another potential substitute for redcedar. It has a better grade and quality, and higher insect resistance, but is less available, more expensive and is subject to concerns over sustainability.
Looking beyond the survey it must be stated that there are no strength grade or construction grade specifications developed for eastern redcedar. Eastern redcedar does not grow particularly tall, so long lengths of lumber, required for construction, are not available to the construction industry and would not meet building code requirements.
Furniture and gift items
Eastern redcedar can be used for almost every kind of furniture, especially for cedar
chests, wardrobes and closets. The fragrance of cedar is recognized for repelling moths.
Cypress may be a substitute for eastern redcedar in the manufacture of furniture or gift items. It can be cut to longer, wider material. However, cypress is more expensive, less available and harder to work with. Pine and oak are also substitutes for redcedar in manufacturing boxes and novelties but eastern redcedar is less expensive.
Mulch
Compared with the mulch obtained from other types of wood, eastern redcedar mulch
distinguishes itself by its appealing color, which resists fading better than other
natural products. The color is complemented by the attractive aroma and insect (termite)
deterring properties.
Shavings
If used as pet shavings, eastern redcedar is better quality than pine shavings, rice hulls
or saw dust. It is more available and healthier to animals, but it can be more expensive.
If compared with polystyrene, hay or canvas to pet bedding, eastern redcedar pet bedding
is higher in quality, natural, and not harmful to the environment. On the flip side, it
is more expensive and less available than these potential substitutes.
The phone survey confirmed that eastern redcedar is perceived to be unique, with very few close substitutes. Eastern redcedar possesses a unique fragrance, rot resistance and insect repellent qualities all derived naturally that places it in a niche by itself.
Force 5: Rivalry among existing firms
|
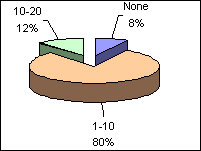
| Figure 38: Number of companies that sell/buy/use redcedar products in area |
Rivalry among existing competitors can be fierce. Companies can never stop learning about their industry, their rivals, or ways to improve or modify their competitive position. When studying the eastern redcedar market, the mail survey provided us with information about who the players in the redcedar market are but not very much about the competitiveness of the industry. By using targeted questions, the phone survey provided more information about the competitive environment in the redcedar industry.
Based on the phone survey, the level of rivalry in the eastern redcedar market is perceived as non-competitive to moderately competitive. Only 8% of the 25 respondents considered the industry to be highly competitive while 48% considered it to be non-competitive (Figure III, Appendix). One reason of reaching this conclusion is the small number of competitors in any given area. Eighty percent of the respondents mentioned between one to ten companies that sell/buy or use redcedar products in their area, while 8% are without any local competitors. (Figure 38)
|
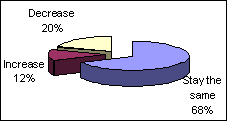
| Figure 39: Opinion about the number of competitors in the next 5 years |
Respondents indicated that the number of competitors will either stay the same (68%) or decrease (20%). Only 12% of respondents felt that the number of competitors will increase in the next 5 years (Figure 39).
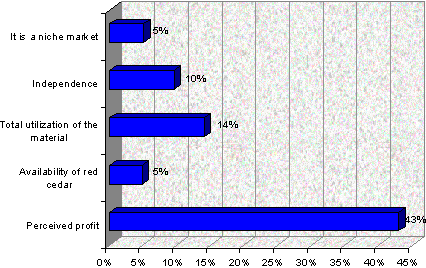
Phone survey respondents indicated that competitors are attracted to the eastern redcedar industry by two classes of factors. Generic factors such as the perceived profit and the independence that a private business offers would attract some competition. Specific factors for the redcedar industry such as the total utilization of the product, the availability of redcedar and the fact that this is a growing niche market would attract other competitors (Figure 40).
|
| Figure 40: Aspect of business that would attract competitors |
In response to new competitors, most (68%) of the companies already present in the redcedar market stated that they had no special strategy or reaction to new companies entering the market. Their approach is to keep producing their products, focusing on quality service.
Another 16% of the respondents indicated that they would have a cautious reaction towards a new competitor. They mentioned that they would strengthen relationships with other participants in the value chain as a reaction to new competition. The relationship between suppliers and buyers plays an important role in the ongoing success of those already in the market. Good communication and good relationships with the suppliers and customers will assure protection from new competitors.
Only 8% of respondents stated that they would welcome competitors because competition is the best thing in the world for a business. Another 8% declared that they wouldn't like to be pressured by new competitors and they would possibly cut prices to maintain their position in the market.
Based on the responses from the survey, the level of rivalry in the redcedar industry is relatively low. The participants in the redcedar industry may only compete for raw materials in areas where quality inputs are scarce.
Additional Market Forces: Policy
Although governmental and non-governmental policy is not recognized as a "force," per se, the Five Forces Model acknowledges that policy influences all forces in the model. Several policies were mentioned during preliminary interviews that were perceived to have an affect on the redcedar industry. Those policies included:
- the ban on CCA treated lumber,
- the implementation of sustainable certifications for suppliers to Lowe's and Home Depot, and
- management practices adopted by State natural resource agencies determined to eradicate redcedar.
These policies all were perceived to have an effect on either the potential supply or the demand of redcedar. Through follow-up surveys and interviews it was determined that the policies that were presumed to have the greatest impact, had little or no impact on the market. For example, it was presumed that with the ban on CCA treated lumber, the demand for the rot resistance of redcedar lumber would impact that market in a positive way. However, several factors have minimized the effect of that ban. First, although CCA has been banned, it is still readily available in any retail outlet. Second, other alternate methods of treating wood have taken the forefront and are being promoted as viable alternatives. Finally, only a very small amount of the redcedar sold in the market was used as an alternate for CCA treated lumber, such as in decking and fencing material.
Sustainable forestry was also perceived to be a policy issue that would have a major impact on the market for redcedar. For the most part, eastern redcedar is not harvested or managed in a way that would be consistent with sustainable management practices. In northern and western Missouri, redcedar is cut out of fence rows or cleared out of areas where regeneration is not wanted. However, due to its persistence, redcedar remains a species that is spreading rapidly. Certain large volume retailers had insisted that all their lumber be sustainably harvested, meaning that care is taken to ensure future harvests and preserve forest health. It was feared that these retailers would pull eastern redcedar products off their shelves until suppliers could certify that the redcedar was being sustainably harvested. There are no significant producers of certifiable redcedar products. Fortunately, over the past year, this requirement has been relaxed and redcedar is still being sold in large volumes at these retail institutions.
Finally, it was reported that several States have adopted the policy of cutting and burning young redcedar trees in order to prevent its further spread. These management practices have had a minor effect on the supply in some areas, but are not widespread. Alternately, other policies adopted by the government have increased the potential supply of redcedar. For example, many of the conservation easement programs funded by the United States Department of Agriculture have removed management from agricultural land and allowed redcedar to spread into areas that were once cropped or grazed. It appears that the redcedar industry has been relatively free from direct governmental policy intervention.

