Participants In The Research
States surveyed
The geographic distribution of the 58 respondents of the mail survey is presented in Figure 3. Responses came from 16 states, predominantly east of the Rockies.
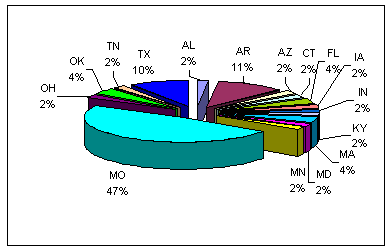
|
| Figure 3: Distribution of respondents from mail survey |
Out of the 58 respondents, 25 participated in the follow up phone interviews. Their geographic distribution is presented in Figure 4.
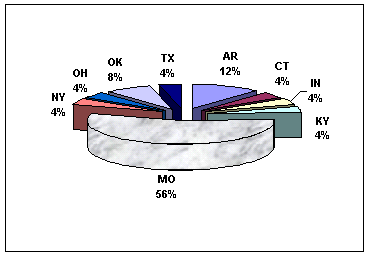
|
| Figure 4: Distribution of phone survey respondents |
The majority of respondents were from Missouri. A broader geographic distribution was obtained during the mail survey (16 states) compared with the phone survey (only 9 states).
Value chain position in the eastern redcedar market
The distribution of the mail and phone survey participants based on their role played in the eastern redcedar market is presented in Figure 5. Primary and secondary manufacturers were the dominant respondents to the phone survey. We should note that respondents could be categorized as more than one of the labels i.e. a respondent could be both a primary and a secondary manufacturer.
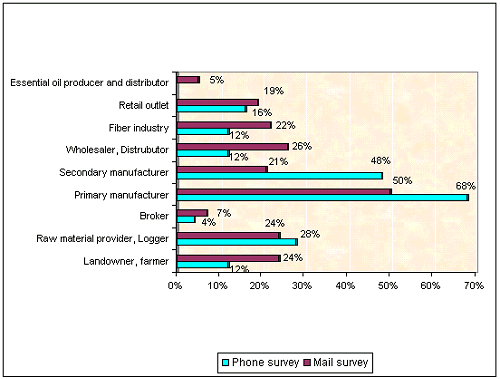
|
| Figure 5: Value chain position for mail & phone survey respondents |
Years in business
Results show that the number of firms relatively new in the market far outweighs the number of firms with tradition in the marketplace (~70% of the surveyed firms have been in the eastern redcedar business for less than 20 years and ~50% less than 10 years compared with ~30% that have more than 20 years of experience in the market - Figure I - Appendix).
This suggests that redcedar is a growing industry. New and more diversified firms entered the market and new uses continue to be found for eastern redcedar
Gross annual sales
The redcedar market ranges from small operations with gross annual sales of less than $10,000 per year to large firms with gross annual sales over $16 million. Out of the companies participating in the phone survey, 39% specialize exclusively in redcedar. Redcedar represents a majority of the business for 62% of the respondents (Figure 6).
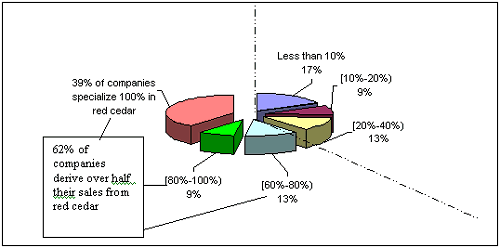
|
| Figure 6: Percentage of redcedar from total gross annual sales (phone survey) |
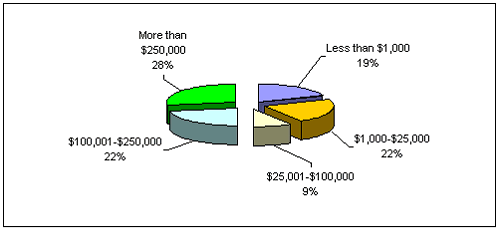
The distribution of the companies participating in the mail survey based exclusively on their gross annual sales from eastern redcedar products indicates that about ¼ of companies (28%) had gross annual sales in excess of $250,000 (Figure 7). [Note that in the mail survey the top sales category was "More $250,000"]
|
| Figure 7: Gross annual sales exclusively from eastern redcedar products (mail survey) |
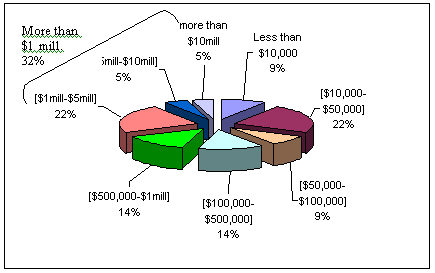
Responses from the phone survey provide a more accurate picture of gross sales figures for companies in the redcedar market (Figure 8). About 1/3 (32%) of the firms in the phone survey indicated gross annual sales from redcedar in excess of $1 million.
|
| Figure 8: Gross annual sales exclusively from eastern redcedar products (phone survey) |

