Black Walnut Financial Model
(Version 2.0)
The Financial Model is an Excel spreadsheet, which asks you a series of questions designed for inputting data about your orchard. Following are instructions and a description of how to answer the Input questions when you open the spreadsheet and begin entering your data. Please read these instructions first before you begin using the Financial Model.
The black walnut financial model is a simplified decision model. It is designed to assist potential growers make decision about tree spacing, nut harvest, and whether to use improved (grafted) or unimproved trees. The model does not claim to accurately show tree growth characteristics at future points in time. However, it does use a simple algorithm to make estimates about future nut production and tree diameters. The model should be used to consider how certain management decisions, i.e. tree spacing, will affect the financial performance of the plantation in terms of potential increases and decreases in net present value, internal rate of return and annual equivalent value. All financial numbers are given on a per acre basis.
The model is an extremely simplified tool. On the INPUT page there are 10 questions in the yellow area that can be answered by the user and 2 output summaries.
Guide to Input questions:
- What is your initial spacing? - Identify the within row and between row spacing in feet. For example, the trees may be planted on 10' X 20' spacing. The program will take this spacing and calculate the number of trees per acre.
- Do you plan to harvest the nuts? - Requires a simple "yes" or "no". A "yes" answer will automatically incorporate a nut harvest cost at 50% of the nut income. A "no" answer will remove any expected nut harvest cost from the model.
- Grafted/improved Trees? - Requires a simple "yes" or "no". A "yes" answer will incorporate a seedling cost of $8 per tree, and a "no" answer will incorporate a seedling cost of $0.30 per tree.
- What is the expected growth rate of the trees per year? - In order to estimate the growth rate, input a number that reflects the average expected rate of growth for the trees in inches. This is measured at breast height on the tree. The program uses an algorithm to reduce this rate when crown competition begins to negatively effect the growth of the trees. When the Crown Competition Factor (CCF) exceeds 115%, the program will automatically calculate a thinning. If the thinning occurs when the diameter is too small to be merchantable (less than 15 inches DBH) a variable cost of removal is applied. For a DBH of greater than 15, a market price is applied based on a percentage of the answer to question number 6 below.
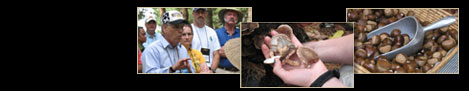
- How much will the nuts sell for? - Input a market price per pound based on the local or target market. For example, a local huller may pay $0.13 per pound, whereas, the targeted market may be selling directly to Hammons Products at $0.45 per pound. If the answer to number 2 above is "no", this question will have no bearing on the financial analysis.
- How much will the timber sell for on a board foot basis at final harvest? - Input an estimate of the average stumpage price per board foot that would be expected for the walnut lumber if sold at financial maturity (24-26 DBH). An estimate of this can be obtained from the Missouri Timber Market Price Trends report published by the Missouri Department of Conservation.
- What return would you like to earn on your investment? - Input an expected return on investment. For example, if a decision maker would like to earn 5% on every dollar invested, then they would enter 0.05 in the blank.
- How long will the future marketable log be? - Input a length in feet of the first "clear" log on the tree. A "clear" log is one that is branch free and has the potential of being sold as veneer quality or as a FAS sawlog. This log length is used for three purposes in the model. First, the length of the log will determine the market value of the final harvest of the trees. For example, a longer log length may increase the final timber harvest value because more clear wood is sold, but pruning costs are higher. Second, the model estimates a reduction in expected nut yield as more of the lower branches are removed. The model can estimate if it is more profitable to grow the trees for timber, nuts, or both.
- What will the diameter of the tree be at final harvest? - Input the anticipated average diameter at breast height in inches of the trees just prior to final timber harvest. The model will take the growth rate indicated in question 4 above and determine what year after planting the trees will reach the final harvest diameter. At that time, the model will automatically calculate the income from a timber sale on the number of trees that are remaining at that time.
- What percentage of the trees will be removed at each thinning on average? - In version 1.0 of this model thinning rates could not be altered and were set at a predetermined rate of 50%. In other words, each time the model determined that a thinning was needed; it would remove 50% of the standing trees. Version 2 of this model gives the decision maker a little more flexibility in that it allows them to determine an average percentage of trees removed at each thinning. A number between 0 and 1 should be entered to reflect the average removal percentage. For example, if the decision maker chooses to thin one-third of the trees at each thinning, then they would enter .33 in the blank. This input variable has a dramatic effect on the number and timing of thinnings, as well as the cost and revenues incurred on the system.
Additional Inputs:
New to Version 2.0 are some additional variables that can be used to enhance the decision maker's flexibility in the model. These additional inputs are found by clicking on the Calculations tab and entering data next to the yellow boxes. These additional inputs include:
- Cost of improved seedlings - Input the expected or actual improved seedling costs. The importance of this block is to allow current prices for seedlings to be incorporated into the financial analysis of the model.
- Cost of unimproved seedlings - Input the current cost of unimproved seedlings. Similar to the input variable above, this allows current costs to be incorporated into the model.
- Alternate bearing factor - The alternate bearing factor reflects the idea that black walnut trees have the tendency to have heavy nut production years and light nut production years. This variable incorporates this "alternate bearing" condition into the model by reducing the expected nut yield by the amount of the factor. For example, trees that produce a large crop of nuts every other year would have an alternate bearing factor of 0.5. This would reduce the nut crop over the life of the trees by half in order to reflect the years that the trees do not produce a heavy crop. Trees that do not have the alternate bearing characteristic would have an alternate bearing factor of 1. Trees that produce a heavy crop 1 year out of every 3 (1:3) would have a factor of 0.33.
- DBH @ Year 5 - Because of the simplified nature of the model, a linear growth model is used. However, the model was not designed to reflect the growth of young trees. Therefore, the model underestimates the size of young trees. The DBH @ Year 5 variable allows the user to tell the model the size of the young trees in order to correct the growth error caused by the simple linear model. A default value of 2" DBH is used in the model; however, the decision maker can adjust that based on their site and management conditions.
Output summaries:
Version 2.0 of the Black Walnut Financial Model has condensed the three output summaries that were available in Version 1.0 down to two. NOTE: Version 1.0 of this model had an Establishment Summary which described the cost of establishment details along with other details about nut and timber income. This summary was combined with the Financial Analysis Summary.
This summary also indicates the year in which the trees are expected to start producing a nut crop that is large enough to justify the expense of harvesting. NOTE: The estimated year for commercial nut production is not an indication of the first year the trees will produce nuts; however, it is an estimation of the first year in which the trees will produce a large enough volume of nuts to have a positive income from harvesting the nuts.
- Thinnings - shows a schedule of the timing and cost or revenue from pre-commercial or commercial thinnings conducted on the plantation. The year, DBH, value, and number of trees removed are summarized for up to seven thinnings. NOTE: Because of the addition of input question 10 above the model is no longer limited to a 50 percent thinning schedule. However, it should be noted that if the thinning percentage is very small, many more thinnings will be required during the life of the system and this summary may not be able to show all the possible thinnings. For more details on number of thinnings and the costs and revenues associated with those thinnings, click on the Calculations tab at the bottom of the page and review the table entitled Thinning Calculations. It should also be noted that due to the limitations of EXCELtm, the model can only accurately calculate up to seven thinnings. This is a problem for low thinning percentages that generate more than seven thinnings.
- Financial Analysis - summarizes the Net Present Value (NPV), Internal Rate of Return (IRR), Annual Equivalent Value (AEV), and the Modified Internal Rate of Return (MIRR) for the plantation. NPV and AEV is calculated using the expected rate of return indicated in question 7 above. Two time frames for analysis are used, Final Harvest and 40 years. The Final Harvest analysis will indicated the financial performance once all trees have been removed (in the case of a timber harvest) or into perpetuity (if the nut crop provides the best return). The 40 year analysis is added to give an estimate of the financial performance of the trees at a "benchmark" time. The "benchmark" time is an arbitrary point and is used to reflect the financial performance during the life of the trees. Any year could have been used, this model uses year 40.
- NPV is the discounted value of all costs and revenues on a per acre basis. The rate used to calculate NPV is the rate indicated in question 7 above.
- IRR is the actual rate of return earned on every dollar invested in the trees.
- AEV is an estimate of an equivalent annuity payment that would have the same NPV as the plantation. Once again, the discount rate is the rate indicated in question 7 above.
- MIRR is another method for calculating the actual rate of return for the trees. It is often used in financial analysis when there are alternating periods of costs and revenues. For example, black walnut trees may have several years of costs before any revenues are earned, or there may be years where costs exceed revenues due to required management activities. As a result, these cyclical costs and revenues will cause a calculation error in e IRR. The MIRR levels out those cyclical returns by applying a finance rate to years when costs are greater than revenues and a reinvestment rate when revenues exceed costs. The finance rate used is equal to the rate of return indicated in question 7 above. It is assumed that the decision maker would expect to return a rate equivalent to the cost of capital (in other words, a minimum rate of return to cover the cost of borrowing money). The reinvest rate used in the model is 5%, and is based on the expected return for a low risk investment, such as a bond or certificate of deposit. The financial analysis summary also indicates the number of years required to recover the cost of establishment. This is the estimated number of years required before the IRR is greater than zero.
New with Version 2.0 is the inclusion of additional information in the Financial Analysis summary. This additional information indicates the number of trees initially planted along with cost per tree and cost per acre to establish those trees. It also includes information describing the year, volume, and value of a final timber harvest if the model estimates that a final timber harvest will provide the best financial return. If the nut income is estimated to provide the best financial return, then no timber harvest will be conducted and the model will estimate a perpetual income stream from the nut crop. NOTE: The model is limited to a 100 year timeline. If the growth rate (question 4 above) is too slow to reach the diameter at final harvest (question 9 above) then the model will estimate a final harvest value based on the calculated DBH at year 100 and the value per board foot (question 6 above) may be reduced. The summary will indicate the DBH, volume, and value of the final timber harvest at year 100. For nut income, the model will take the estimated nut crop at year 100 and calculate an income from year 100 into perpetuity using the expected rate of return (question 7 above).
This summary also indicates the year in which the trees are expected to start producing a nut crop that is large enough to justify the expense of harvesting. NOTE: The estimated year for commercial nut production is not an indication of the first year the trees will produce nuts; however, it is an estimation of the first year in which the trees will produce a large enough volume of nuts to have a positive income from harvesting the nuts.
Other Outputs:
This model can also provide an enterprise budget to the user. By clicking on the Enterprise Budget tab, a printable budget reflecting costs and revenues can be viewed. A cash flow diagram is also available for viewing by clicking on the Cashflow tab. The cash flow diagram will show the NPV, IRR, AEV, and MIRR for each year, along with the estimated revenues and costs.
Advanced Options:
Most of the program has been locked to prevent keystroke errors by users. However, different costs can be manually applied to the model by "unprotecting" the Cost Calc. worksheet and modifying the costs per acre figures. The program is designed to pull cost information from this worksheet.
Limitations of the Model:
Because of the simplicity of the model, there are several important limitations that must be taken into consideration. As noted earlier, this model is limited to a 100 year time frame. The model also applies a strict 50% thinning whenever a thinning is required. The purpose of the model is to provide an indication of the direction of change for certain management decisions (for example, a closer initial spacing versus a wider initial spacing), and a basis for determining which strategy would work best for a certain site (such as, a site that only grows trees at 0.25 inches per year may be best suited for nut production versus a site that grows trees at 0.5 inches per year). In most cases the default cost structures used in the model are sufficient to achieve the analysis desired, since they are held constant throughout the analysis.
Questions or Assistance:
For more information or technical help with the model, contact Larry Godsey, Center Economist, University of Missouri Center for Agroforestry (godseyl@missouri.edu).